The GANMapper is a conditional GAN (if you want to learn more about GANs, you can read our last post : Generative Adversarial Networks), issued by two researchers : Abraham Noah Wu a PhD researcher at National University of Singapore who has a master degree in Architecture, studying new uses of urban data using deep learning and Filip Biljecki, an assistant professor at National University of Singapore who realized his PhD degree in 3D GIS and Geomatic engineer.
GANmapper’s main idea
The two researchers start from the premise that few studies have been carried out involving GANs in the geographical sciences. For example, GANs are used to translate satellite images into cartographics representations or to generate realistic satellite images. That is why they decide to fill the gap by investigating if GANs can be applied in geospatial data. The main idea of their project is to use GANs to create new geospatial features on maps and to contribute to increase the completeness of data for geospatial datasets such as Open Street Map. Today, a lot of geospatial datasets like land use datasets, street networks or population data from each district, etc, are available at a worldwide level and for free but some features are still missing. In fact, they realized that important elements sometimes don’t appear on maps such as building footprints, 3D models and any type of point of interest. In the case of Open Street Map, the road network is generally complete and well detailed, but for building footprints, the data is heterogeneous and sometimes of poor quality. Therefore, the two researchers decided to base their study on building’s footprint generation.
As they explained in the paper, some artificial intelligence techniques to generate building footprints already exist but the quality of the resolution depends on the scale of the images and the larger the scale, the poorer the resolution is. Those techniques are mostly used to enrich the existing data. Accordingly, they decided to create a model capable of generating building footprints by using GANs in a way that it can predict one spatial dataset from another. They call their model GANmapper and define it as a “Generator of spatial data on buildings footprints capable of creating realistic looking and hierarchically correct building footprints data from other related urban datasets such as street networks”1.
Given that, the footprints are completely made out of scratch and this is the most impressive of this work. Nevertheless, the authors specify that those buildings’ footprints aren’t exactly the same as those in reality but really close and the goal is to represent the urban morphology as accurately as possible. On the other hand, the model is also very helpful for urban planners to understand the morphology of cities and design new ones by generating them with GANmapper. In the future, they will also try to generate other features with the same model.
The GANmapper model is an image-to-image translation conditional GAN using an autoencoder with nine residual blocks. The general architecture is close to the pix2pix GAN. As an input, the researchers gave to the model the street networks dataset and some pictures also called target images of building polygons from Open Street Map. Only with that amount of information the model is able to learn the differences between buildings along little streets and those along highways and mostly thanks to the size of the streets and the information related to each kind of it.
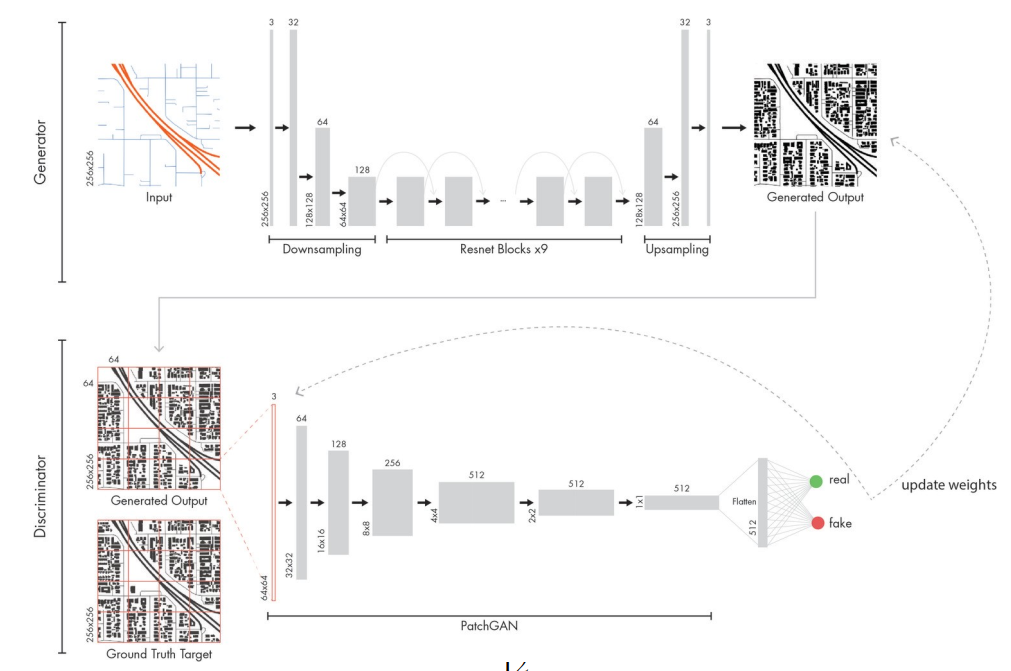 Figure 1: The GANmapper model architecture2
To assess the accuracy of the urban morphology generated by GANmapper, the researchers are using two different metrics. The Frechet Inception Distance (FID), also known as the most commonly adapted benchmark for GAN performance, “[…] assesses the quality of the image created by the generator by calculating the distance between the feature vectors of real and generated images that are computed.”3 The lower the FID score is, the better it is because this indicates that the feature vectors of real and generated images are similar. This means that the representations in terms of shape, size and density are close to reality. The second one is the Mean Intersection over Union (mIoU) which “[…] measures the degree of overlap of the generated to the ground truth. Mathematically, mIoU measures the number of pixels common between the input and generated images divided by the total number of pixels present across both datasets.”4 In this case, a high mIoU score signifies that the generated images overlap with the input images, which means that the model manages to reproduce the right form. Later on, they realize that the mIoU wasn’t fitting for the GANmapper since the loss function measures the difference between real and fake based on visual similarity rather on pixel-wise similarity, which is what the mIoU is using.
However, to have a good result, the data needs to be pre and post-processed. To find the right elements and investigate the performance of GANmapper, the researchers conducted four experiments.
Experiment 1 : Input configuration
Here, they are looking for the best pair input-output for the task. They begin the experiment with three different types of input :
- Land use map : colored-coded land use parcels which gives the gross floor area ratio (GFA).
- Black and White street networks
- Colored Road Hierarchy Diagrams street networks
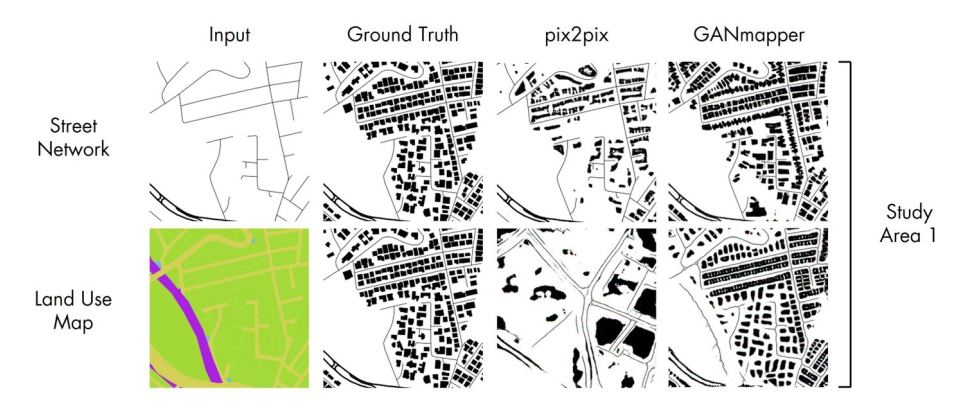 Figure 2: Comparison of the results between each input5
For the street networks input, each street is classified as primary (highways connecting different districts), secondary (avenues connecting neighborhoods) or tertiary roads (capillaries that penetrate the neighborhood). Here, we can see that the best input is the CRHD street networks because thanks to the colors, the model is able to differentiate better between primary, secondary and tertiary roads. The land use map isn’t fitting as well as the street networks because of the GFA which made the model confusing.
Experiment 2 : Tiles scaling
In general the deep learning’s models’ resolution of the input and the output depends on the size of the hardware’s memory. On account of that, they had to convert the targeted area into 256x256 raster tiles into a slippy map to have smaller areas and so a better resolution. They tried with different levels of zoom : 14, 15, 16 and 17 and concluded that a higher zoom level could help the model to generate images with sharp footprints and nice graphics, close to reality. At level 17, the images were well detailed and precise but the model missed out contextual information and as a result of this, the footprints aren’t that accurate. Conversely the level 14 conducted to blurry roads and buildings because the density on each tile was too high. According to the authors, the zoom level 16 is, in general, the best option. Nevertheless the right zoom level depends more on the city itself. For example, a city such as Jakarta needs a 17 level because the street network is really dense but a city like Los Angeles it is not necessary and even confusing for the GANmapper which is looking for contextual information.
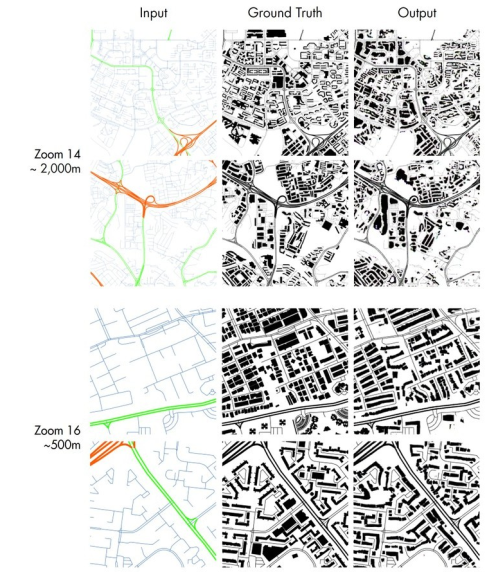 Figure 3: Comparison between different zoom levels6
Experiment 3 : Testing GANmapper
For this experimental phase, the researchers are testing the model in eight separate cities. They applied the same modalities for every city, namely zoom level 16, CRHD datasets and complete examples of ground truth. They realized that the general model was able to understand the urban textures of each city but was still struggling with large building footprints generation. On the other hand, it learns the road’s hierarchy and the appropriate road offsets. Moreover, the GANmapper understood the urban morphology for each city and was able to generate a building typology accurately.
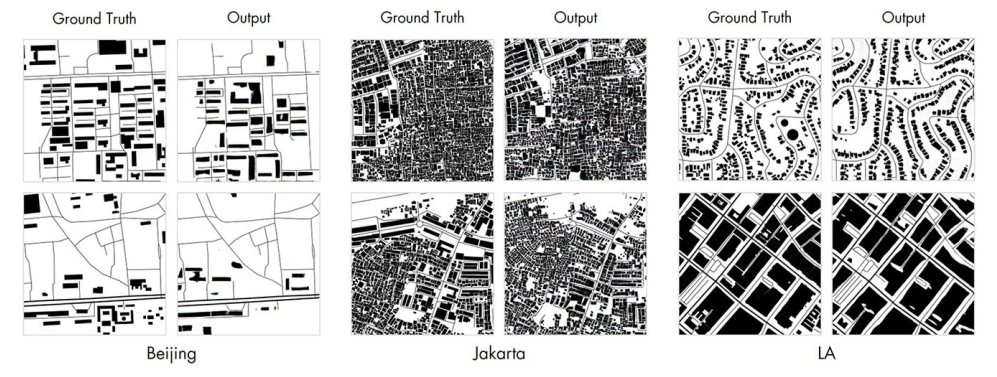 Figure 4: Synthetic results of GANmapper7
Experiment 4 : Stitching tiles back
Here the researchers are stitching back the tiles together to check the consistency between each tiles. We can see that the GANmapper executes the task really well since the tiles are making sense next to each other. It has a correct urban texture in terms of shape, orientation, density and building footprint’s areas and close to the ground truth.
 Figure 5: Stitched output of Jakarta8
In conclusion, the GANmapper is an efficient solution to create datasets that approximately reveal the urban morphology of a city. Nevertheless, it could be better as the authors explained in the paper. In fact, they still have to work on the scaling part and the choice of the zoom level. They also want to add some rules to the GANmapper to help it in the post-processing part to remove buildings from spaces where they shouldn’t be. At last, this experimentation is really impressive by showing the capacities of GANmapper but also very hopeful for future developments in the GIS field using GANs.
References
-
Wu, A. N. & F. Biljecki (2022): GANmapper: geographical data translation. International Journal of Geographical Information Science. 36(7), pages 1394-142, page 4 ↩
-
Wu, A. N. & F. Biljecki (2022): GANmapper: geographical data translation. International Journal of Geographical Information Science. 36(7), pages 1394-1422, Figure 2 page 9 ↩
-
Wu, A. N. & F. Biljecki (2022): GANmapper: geographical data translation. International Journal of Geographical Information Science. 36(7), pages 1394-142, page 12 ↩
-
Wu, A. N. & F. Biljecki (2022): GANmapper: geographical data translation. International Journal of Geographical Information Science. 36(7), pages 1394-142, page 12 ↩
-
Wu, A. N. & F. Biljecki (2022): GANmapper: geographical data translation. International Journal of Geographical Information Science. 36(7), pages 1394-1422, Figure 5 page 14 ↩
-
Wu, A. N. & F. Biljecki (2022): GANmapper: geographical data translation. International Journal of Geographical Information Science. 36(7), pages 1394-1422, Figure 7 page 17 ↩
-
Wu, A. N. & F. Biljecki (2022): GANmapper: geographical data translation. International Journal of Geographical Information Science. 36(7), pages 1394-1422, Figure 8 page 20 ↩
-
Wu, A. N. & F. Biljecki (2022): GANmapper: geographical data translation. International Journal of Geographical Information Science. 36(7), pages 1394-1422, Figure 9 page 22 ↩